More Options
Retail analytics - turning data into actionable information
Harnessing and making use of the wealth of information coming from the numerous data touchpoints in every customer experience is the key to making more informed and ultimately more profitable decisions. RetailOS’ retail analytics, powered by Sisense, makes sure you have that intelligence at your fingertips.
In-store data capture, online activity, staff tracking, sales stats and more all generate millions of datapoints which need to be turned into accessible, useful information which can be fed back quickly to the right people. On the face of it, getting it all to work together can seem impossible - simply putting information into the hands of head office and store associates isn’t enough; it needs to be streamlined, surfaced and managed for sensitivity.
Take a look at our guide to retail technology ecosystems for a comprehensive overview of the types of data you need to harness and why they’re important.
While retail analytics has always been a core part of RetailOS, we listened to our clients and what the industry was saying about their business intelligence wishlists. And as a result we integrated with leading business intelligence company Sisense, known worldwide for their ability to process large datasets, to elevate its features to a new level of accessibility. It is designed with store associates in mind, giving them the most important sales and engagement metrics to help them get the best from their clienteling activities.
Powered by Sisense, our retail analytics dashboard gives you unprecedented ability to visualise, analyse and monitor activity right down to the shop floor and gives managers the insights they need to make better decisions.
From tailored support to streamlined, single-view reporting, our retail analytics dashboard allows you to monitor customer and store associate activity on every device and at every location, leading to greater efficiency and much more accurate analysis. You can pinpoint sales, transaction value, customer loyalty, speed of service and much more, for more effective business planning.
The basics
While metrics are geared towards supporting associates on the shop floor, store and area managers can use the data to assess the overall performance of the stores and individuals they are responsible for.
The benefits of integrating with Sisense include:
- Flexible data visualisation – you can choose from an extensive range of chart types including table, line, bar, pie and many more
- Sophisticated data caching - we can connect our data source to Sisense's high-performance analytics database
- Publish changes without an app release – it’s easy to add new metrics or update existing ones without code changes
- Custom graphs – there’s a flexible, simple process for creating graphs that suit your needs
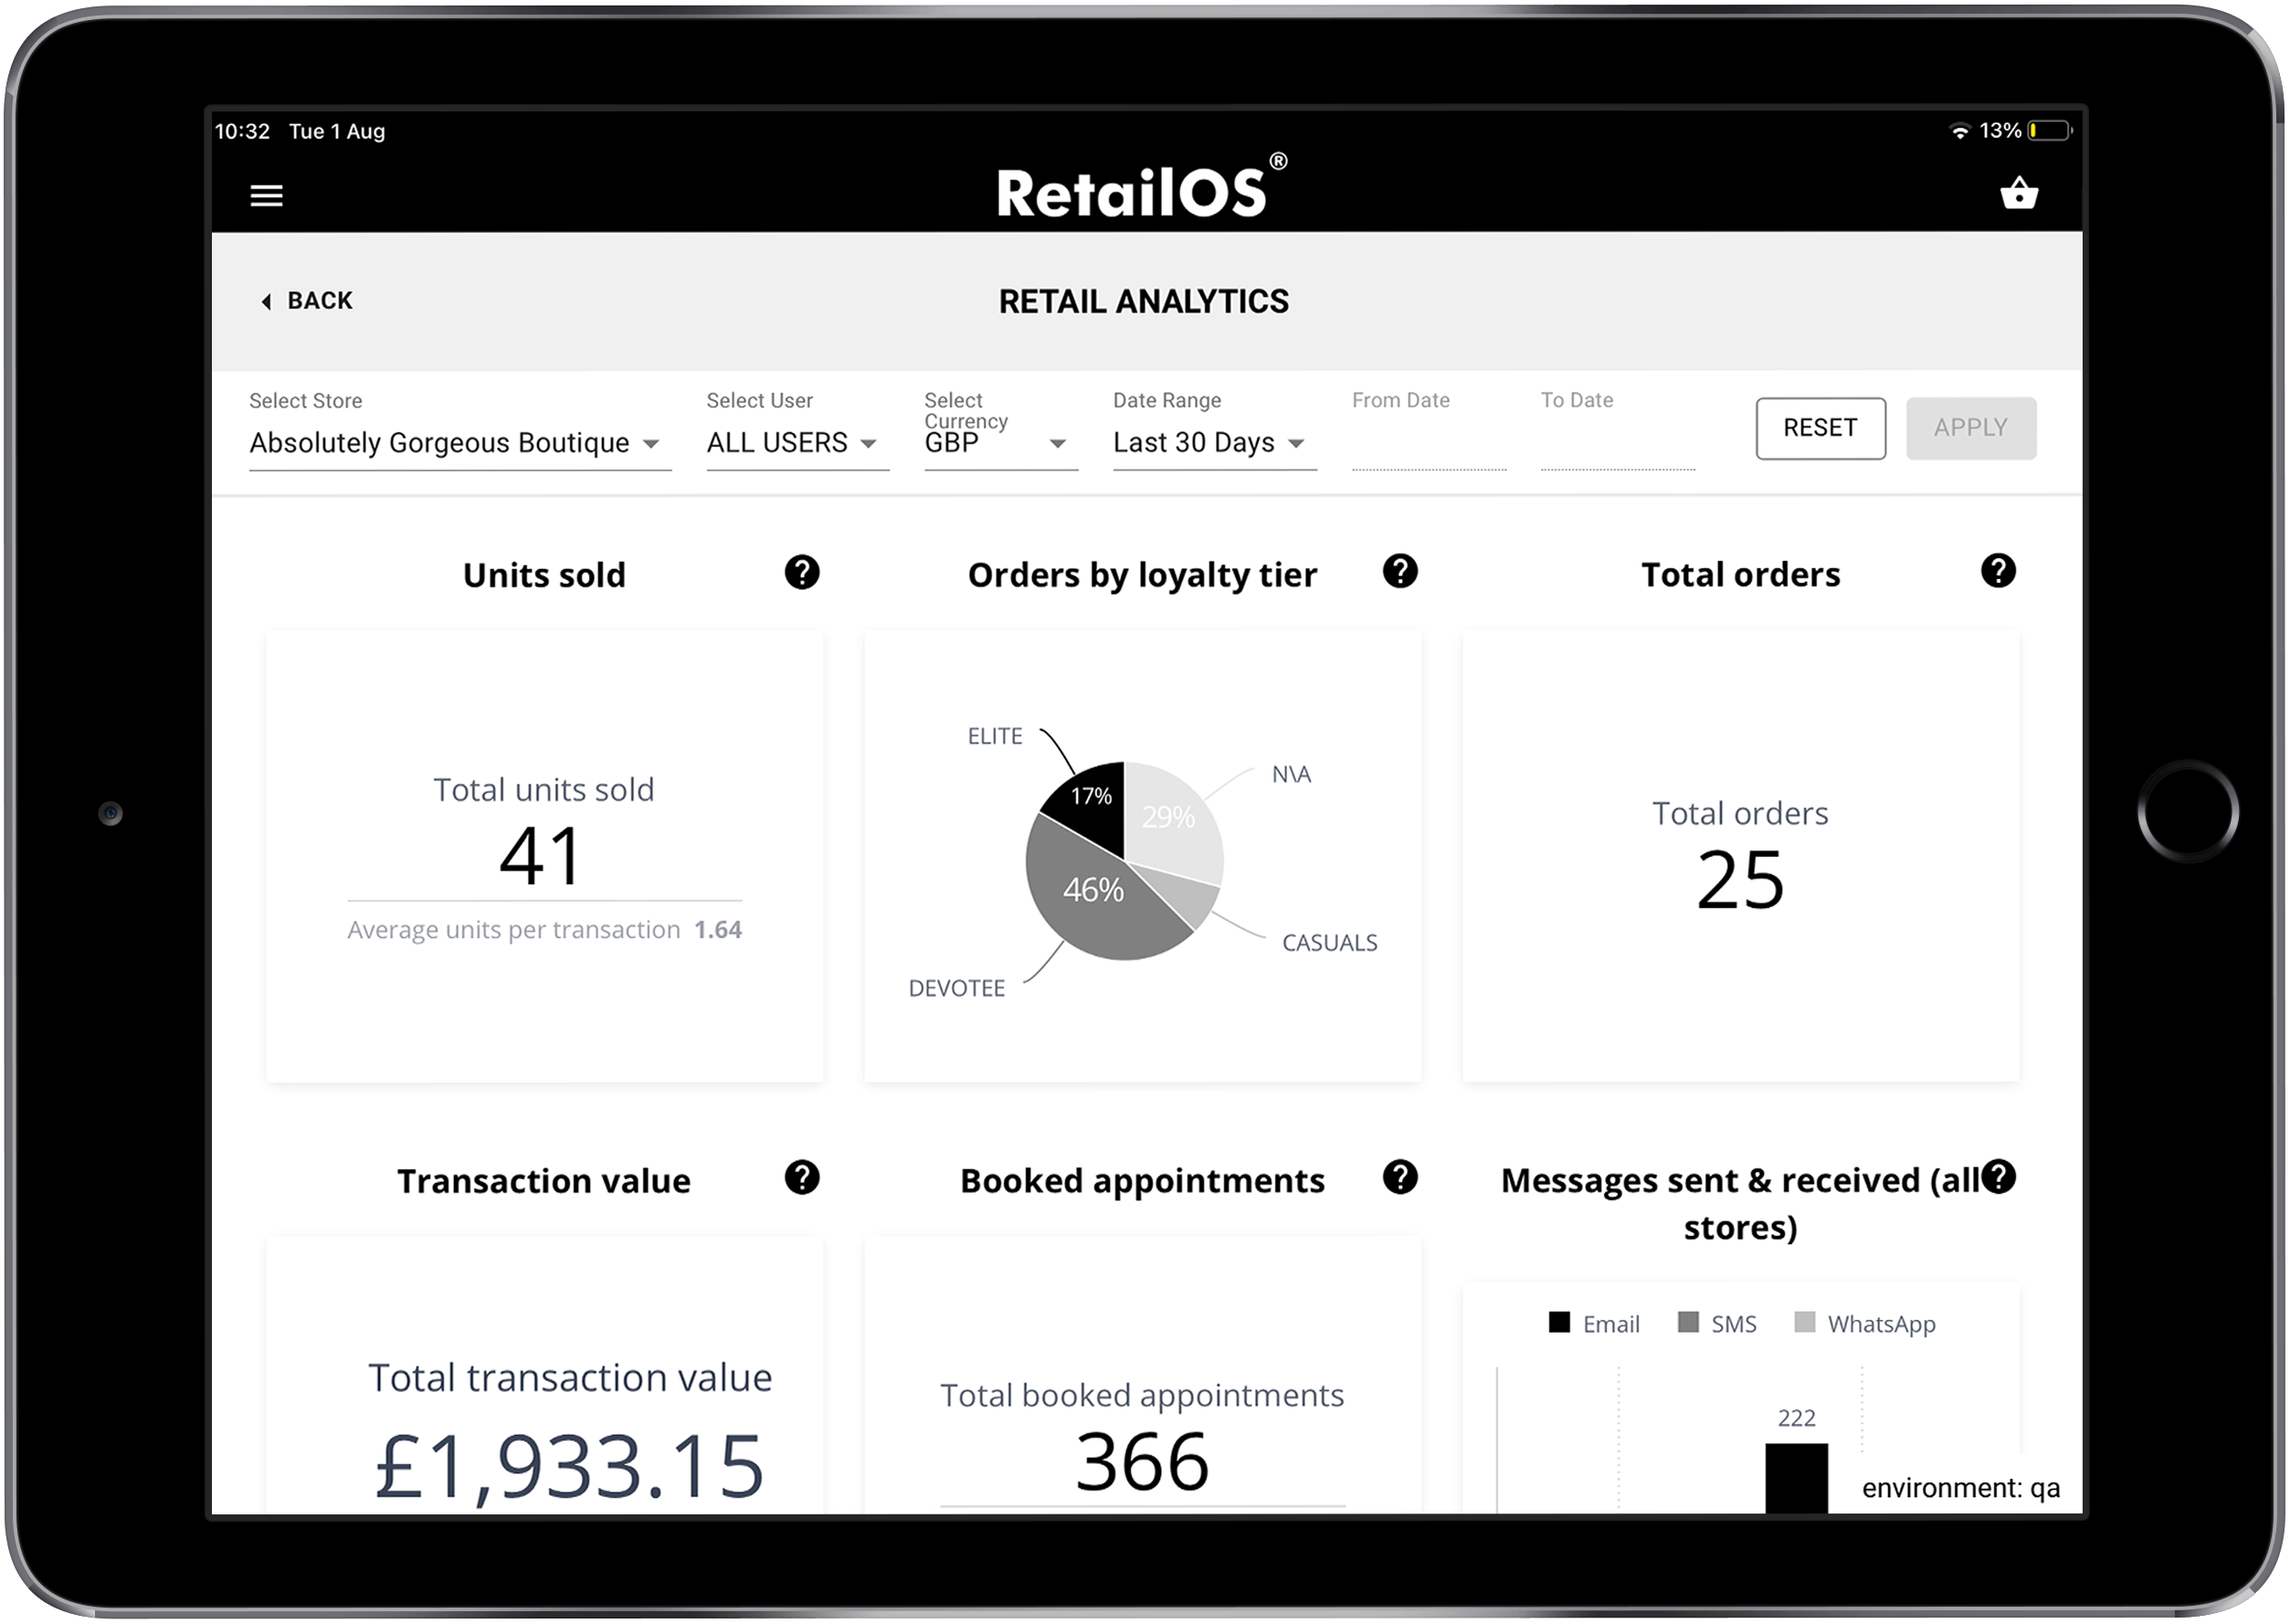
The dashboard
You’re in control of your dashboard’s look and feel, from how the data is displayed to the colour of your charts and content. The retail analytics dashboard is:
- Embedded - Sisense functionality means we are able to embed our analytics dashboard seamlessly into RetailOS, with the ability to customise the look and feel of each element
- Themed - you can set a global theme for the dashboard which will be applied wherever it appears, or you can customise it to match your branding
- Supported with tooltips - they can be set for each chart within the dashboard - this helps to provide more context about what the chart is reporting and how the values are calculated.
The data
To help you and your store associates access the right information, you can filter your data in a number of different ways:
- Store and user filtering – depending on role type, users can filter the dashboard by store (all users) or individuals within each store they are assigned to. You can also include additional filters such as store region and brand, if you are a multi-brand retailer. This is particularly useful for store and area managers who want to compare store associate performance as well as overall performance.
- Timeframe filtering – you have the option to filter data by a set of predefined timeframes which can be extended if required, or you can set a custom date range using the calendar, for when you want to look at a larger or more specific date range.
- Currency filtering – the dashboard reports sales-based metrics in a predefined base currency (GBP), which can be changed depending on your needs. Store associates also have the option to choose a different currency that will convert the metrics based on that day’s exchange rate.
Harnessing and making use of the wealth of information coming from the numerous data touchpoints in every customer experience is the key to making more informed and ultimately more profitable decisions. RetailOS’ retail analytics, powered by Sisense, makes sure you have that intelligence at your fingertips in a comprehensive, readily understood format that helps to improve performance and efficiency where it matters most.
And we’re always working to support your individual data analysis needs – look out for an update soon on even more advanced features including back-end reporting for back-of-house teams and head office, more tailored graphs and the ability to drill further down into your data.
Contact us or request a demo to find out more about elevating your retail analytics as part of RetailOS